Overview
Discover how to access and interpret real-time dashboard views in Emailgistics. Dashboards allow you to visualize key performance metrics for your mailboxes, users, and teams. These dashboards update automatically and provide a live snapshot of your operational performance.
Where Dashboards Are Located
Dashboards can be found in the Dashboard section of the Emailgistics Admin Center. By default, every user who has dashboard access will already have a default dashboard created for them. Users can also create additional dashboards to monitor specific mailboxes, performance areas, or metrics.
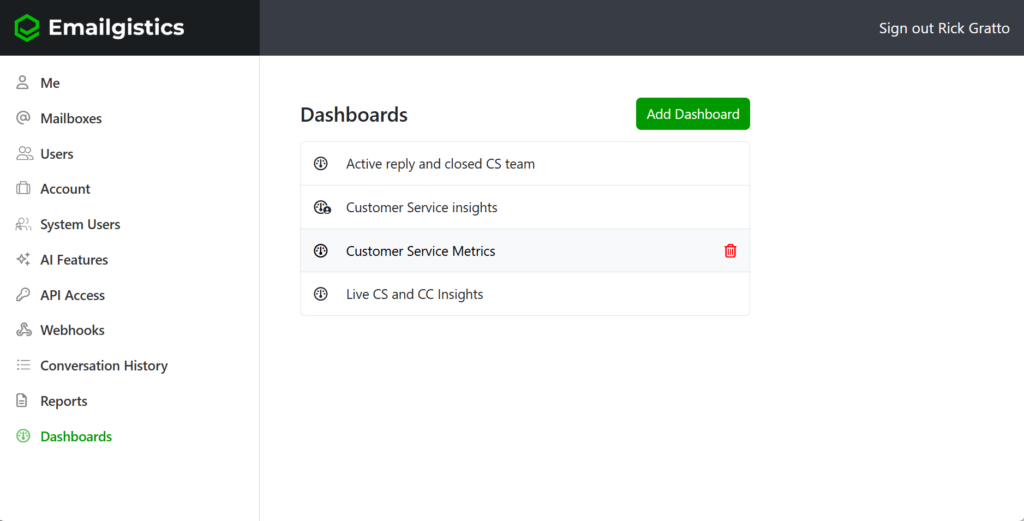
How to Open and Run a Dashboard
To open a dashboard:
- Navigate to Dashboards from the left menu in the Admin Center.
- Select the desired dashboard from the list.
- The dashboard will open in a new browser tab automatically.
Once open, the dashboard begins updating in real time every 60 seconds. This means the data you see continuously refreshes, keeping your team’s view aligned with current mailbox activity.
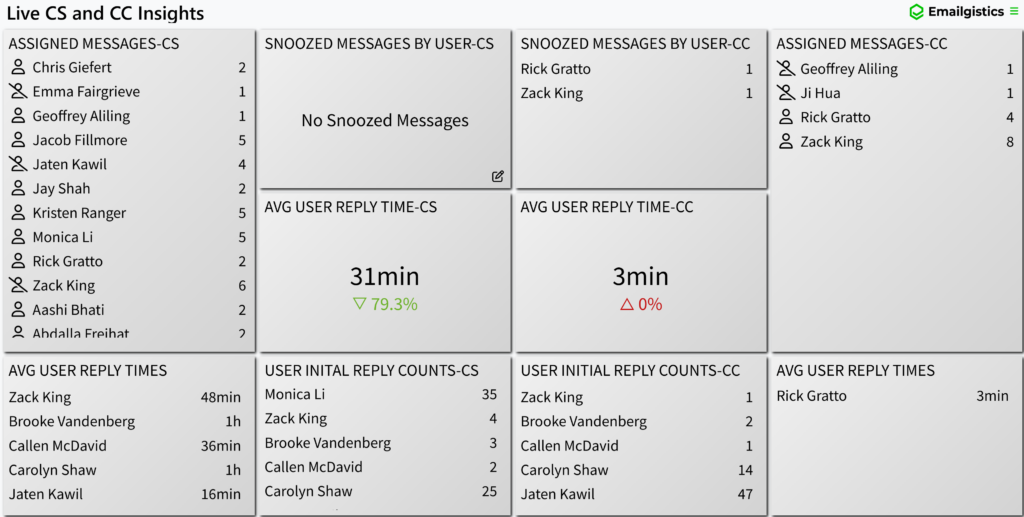
Real-Time Updates
All Emailgistics dashboards refresh automatically every minute without needing manual updates. This ensures accuracy for team performance monitoring and quick visibility into trends such as:
- Assigned Messages per user
- Replied message volumes and performance
- SLA performance
- Unassigned or Closed message counts
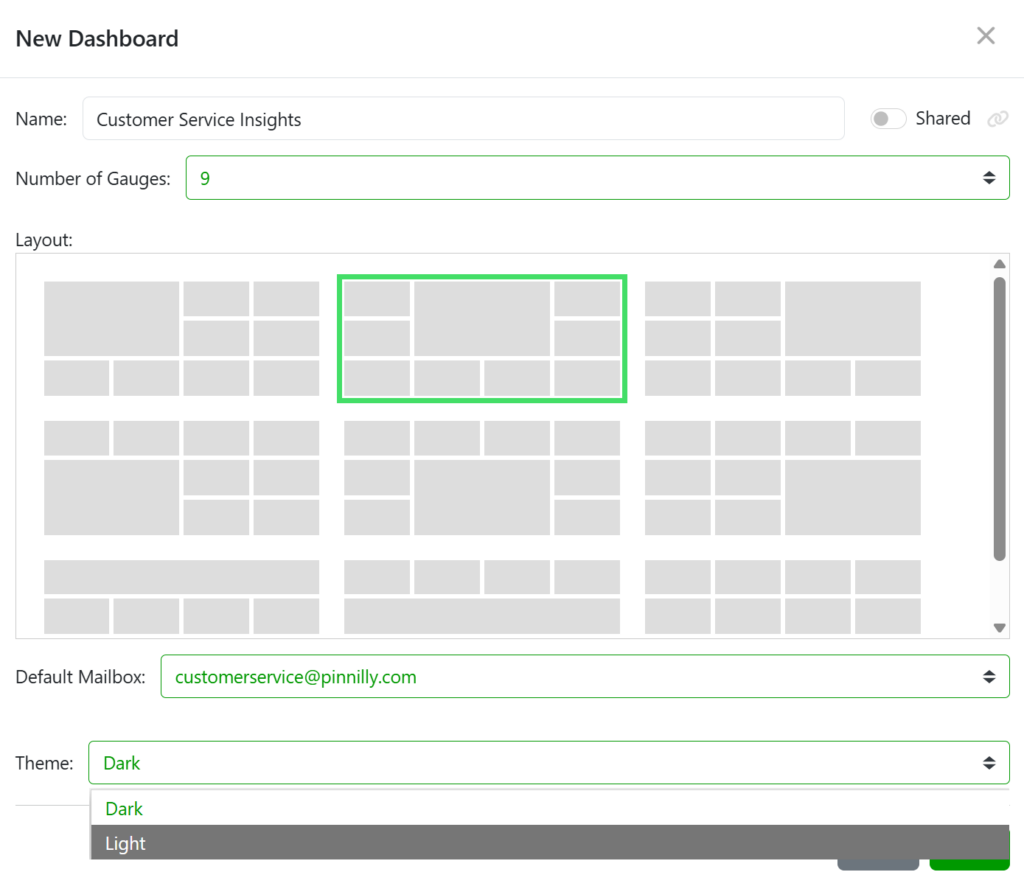
Customizing Dashboards
Dashboards can be modified to fit your preferences and reporting needs. You can configure:
- Layouts: Adjust the placement and size of gauges and widgets.
- Gauges: Choose specific metrics to display, such as response time or total closed messages.
- Themes: Switch between light and dark modes to suit your workspace environment.
Tips for Effective Dashboard Use
Emailgistics dashboards are designed to provide actionable, real-time visibility into your team’s performance and mailbox activity. Here are some ways to use them effectively:
- Monitor mailbox activity and performance in real time to stay aware of live workload levels.
- Identify bottlenecks quickly by tracking message distribution and response times as they happen.
- Track SLA compliance in real time to ensure response goals are being met.
- Get an instant snapshot of what is happening in the mailbox without generating reports or opening Outlook.
- Display dashboards on TVs or large monitors in shared spaces so the entire team can stay aligned on performance.
- Run multiple dashboards simultaneously in separate browser tabs to monitor different mailboxes or departments.
- Use browser add-ins to automatically rotate between dashboards for continuous visibility throughout the day.
If you have any questions or need help on Dashboards please reach out to [email protected].