Overview
The Bucketed Mailbox Performance Report provides a visual breakdown of how long it takes your team to reply to and close messages, grouped into customizable time “buckets.” This report helps you understand overall responsiveness and identify common time ranges for message handling—making it easier to set realistic SLA goals or determine whether your current SLA targets are being met.
Each bucket represents a specific time range, such as 0–30 minutes, 30–60 minutes, or 2–4 hours, showing how many emails were replied to or closed within each time window. You can configure up to five buckets per report.
All times are measured based on the mailbox schedule, ensuring that results accurately reflect your team’s working hours.
Why It Matters
This report is perfect for gauging response efficiency and evaluating whether your team’s current SLA targets align with actual performance.
With this data, you can:
- Monitor team responsiveness and efficiency.
- Identify workload bottlenecks or recurring slowdowns.
- Track SLA compliance for both replies and resolutions.
- Compare current performance to previous periods for trend analysis.
- Drive accountability and improvement within teams.
By visualizing the distribution of reply or close times, managers can make data-driven decisions about staffing levels, workflow design, and SLA expectations.
Purpose
The Bucketed Mailbox Performance Report allows teams to analyze performance within specific time intervals, helping you quantify how quickly most emails are being handled. This makes it an essential tool for service-based teams that rely on prompt communication and accurate SLA tracking.
Key Features & Metrics
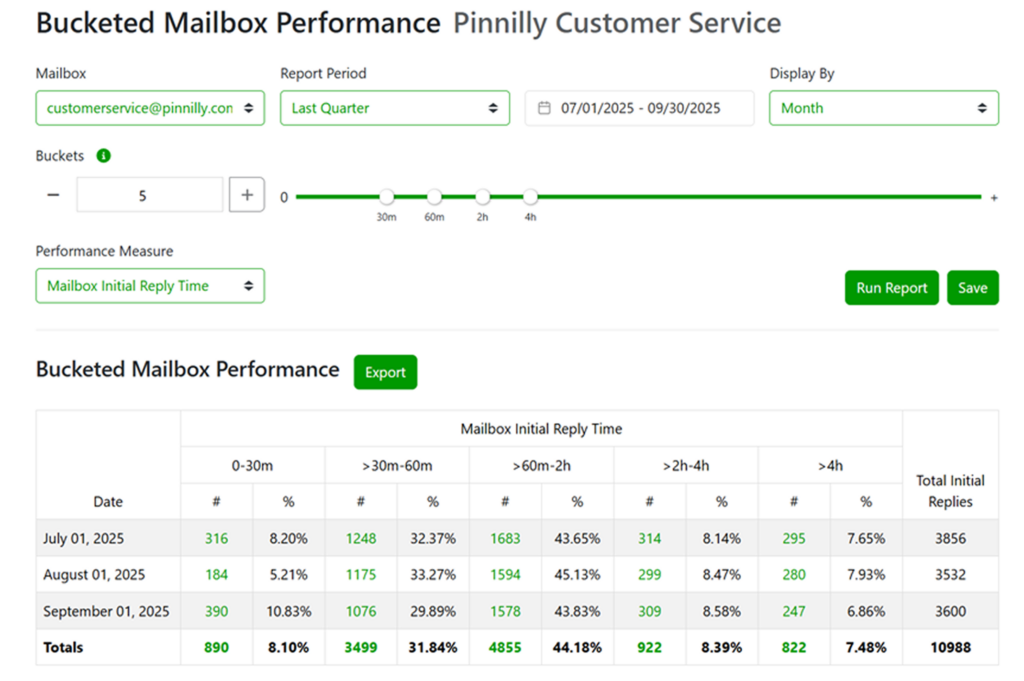
Mailbox Selection
Choose which mailbox to analyze. The report will pull all message data from that selected mailbox.
Report Period
Define the time frame for your analysis (e.g., This Week, Last Month, Last Quarter).
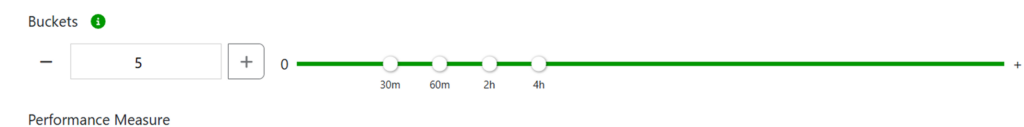
Buckets
Set up to five buckets using the slider control. Each bucket represents a time interval (e.g., 0–30m, 30–60m, 1–2h, 2–4h, >4h). These intervals define how message reply and close times are grouped for analysis.
Performance Measure
Select whether to view performance by:
- Mailbox Initial Reply Time – measures how quickly the first reply was sent.
- Mailbox Close Time – measures how quickly messages were closed.
Display Options
Choose to display data by Day, Week, or Month for trend analysis across time.
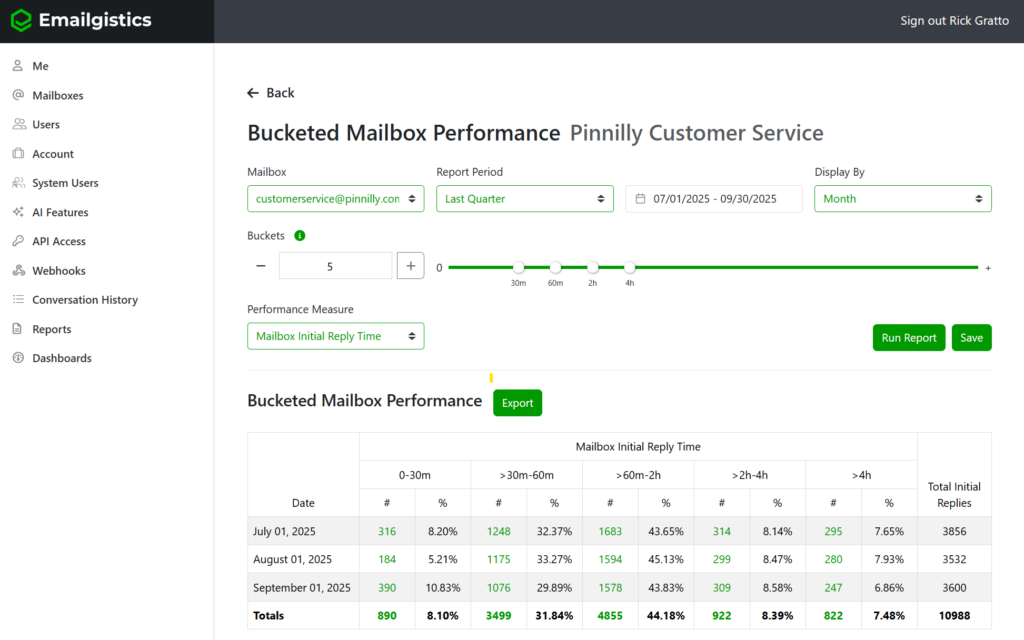
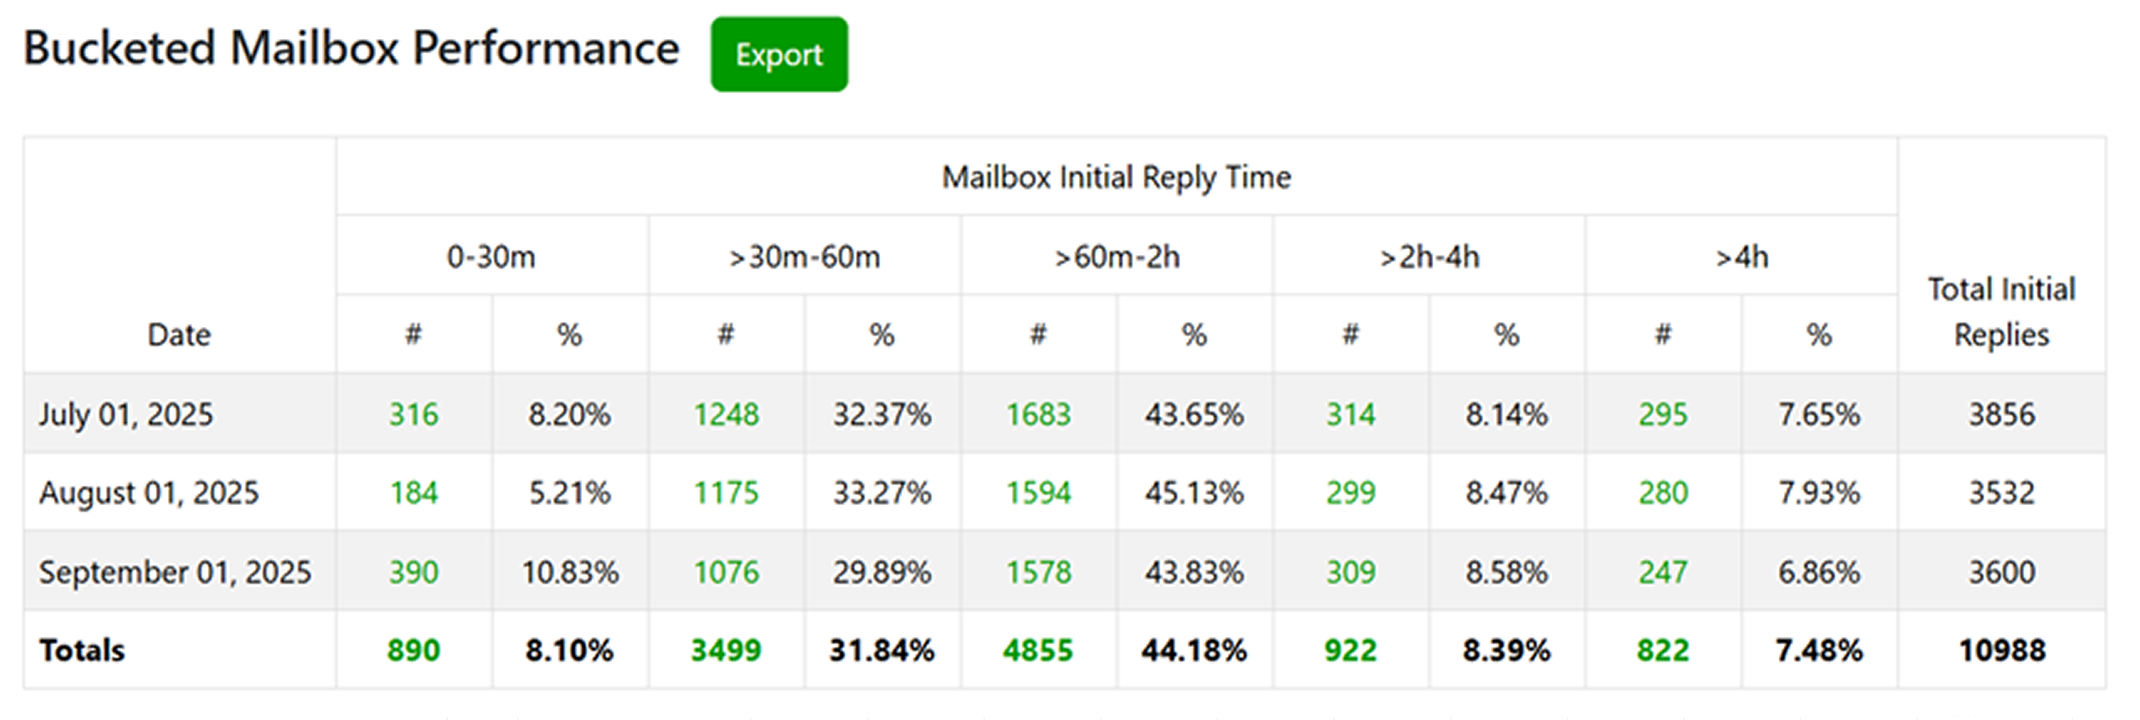
Data Columns Explained
Date: Displays each period (day, week, or month) within the selected report range. 0–30m, 30–60m, 60m–2h, etc.: The time bucket columns showing how many messages fell within each reply or close time range.
#: The number of messages replied to or closed in that bucket.
%: The percentage of total messages that fall into that time bucket.
Total Initial Replies / Total Closed Messages: The total count of messages analyzed for the period.
How to Access
- Log in to the Emailgistics Portal.
- Navigate to Reports → Bucketed Mailbox Performance.
- Choose your Mailbox from the dropdown list.
- Select the Report Period (e.g., This Month, Last Quarter).
- Configure up to five time buckets using the slider or manual input.
- Select the Performance Measure (Initial Reply Time or Close Time).
- Click Run Report to generate your data visualization.
- Use the Export button to download the report for further analysis.
Practical Use Cases
- SLA Planning: Identify the most common reply or close time ranges to set realistic SLA targets.
- Performance Benchmarking: Compare how reply and close times trend across different months or quarters.
- Team Optimization: Detect whether specific time ranges consistently have slow performance, indicating bottlenecks.
- Continuous Improvement: Use bucketed results to evaluate how new workflows or staffing adjustments impact responsiveness.
If you have any questions or need any help with the Bucketed Mailbox Performance Report please reach out to [email protected].